heatmap
toplotna karta
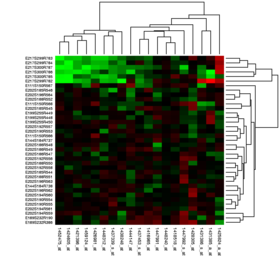
A heat map (or heatmap) is a data visualization technique that shows magnitude of a phenomenon as color in two dimensions. The variation in color may be by hue or intensity, giving obvious visual cues to the reader about how the phenomenon is clustered or varies over space. There are two fundamentally different categories of heat maps: the cluster heat map and the spatial heat map. In a cluster heat map, magnitudes are laid out into a matrix of fixed cell size whose rows and columns are discrete phenomena and categories, and the sorting of rows and columns is intentional and somewhat arbitrary, with the goal of suggesting clusters or portraying them as discovered via statistical analysis. The size of the cell is arbitrary but large enough to be clearly visible. By contrast, the position of a magnitude in a spatial heat map is forced by the location of the magnitude in that space, and there is no notion of cells; the phenomenon is considered to vary continuously.
"Heat map" is a relatively new term, but the practice of shading matrices has existed for over a century.


